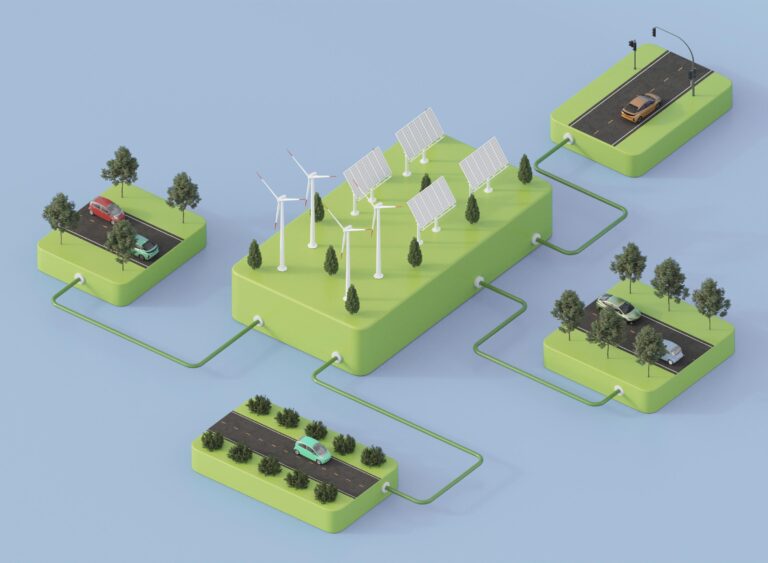
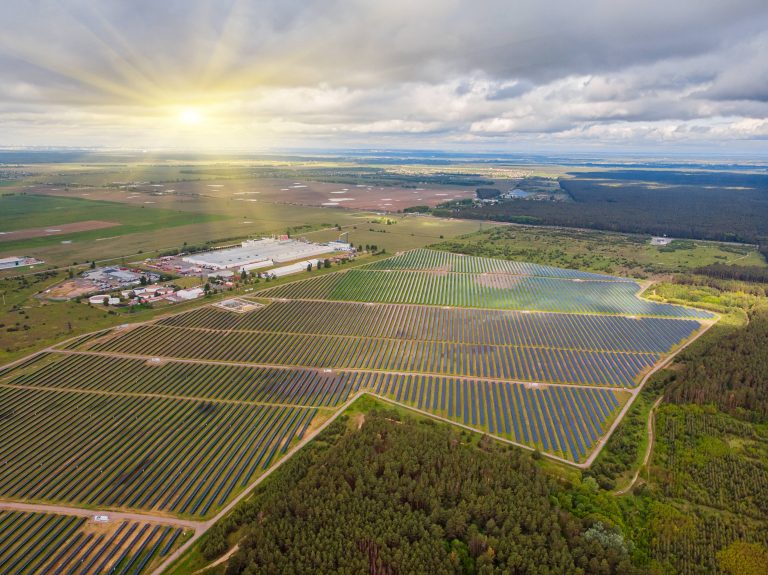
Live data for solar resource assessment and real-time PV monitoring.
Compare the actual production of your plants with the output estimated by our real-time solution to continuously monitor your solar assets: detecting equipment failures, scheduling the cleaning of soiled panels, and optimizing maintenance.
Real-time data can also be used to fill gaps in measurement time series when in-situ sensors are unavailable or malfunctioning.
Our Steadysat technology processes real-time imagery from 5 geostationary meteorological satellites operated by NOAA (GOES-W, GOES-E), EUMETSAT (MSG-0°, MSG-IODC), and JMA (HIMAWARI). These satellites provide complete global coverage with high spatio-temporal resolution — delivering data every 5-15 minutes at spatial resolutions of 500m-2km, depending on region and channel (visible/infrared).
The satellite imagery provides continuous monitoring of cloud properties, including cloud type, opacity, and movement patterns essential for accurate solar irradiance forecasts.
In addition, our team enhances this satellite data by integrating meteorological models to deliver useful information on key atmospheric components that interact with solar radiation, such as atmospheric dust, ozone, and water vapor.
Our technology integrates multiple weather models that account for key atmospheric constituents affecting solar radiation:
These parameters are sourced from the Copernicus Atmosphere Monitoring Service (CAMS) global analysis and reanalysis provided by ECMWF, ensuring comprehensive atmospheric characterization.
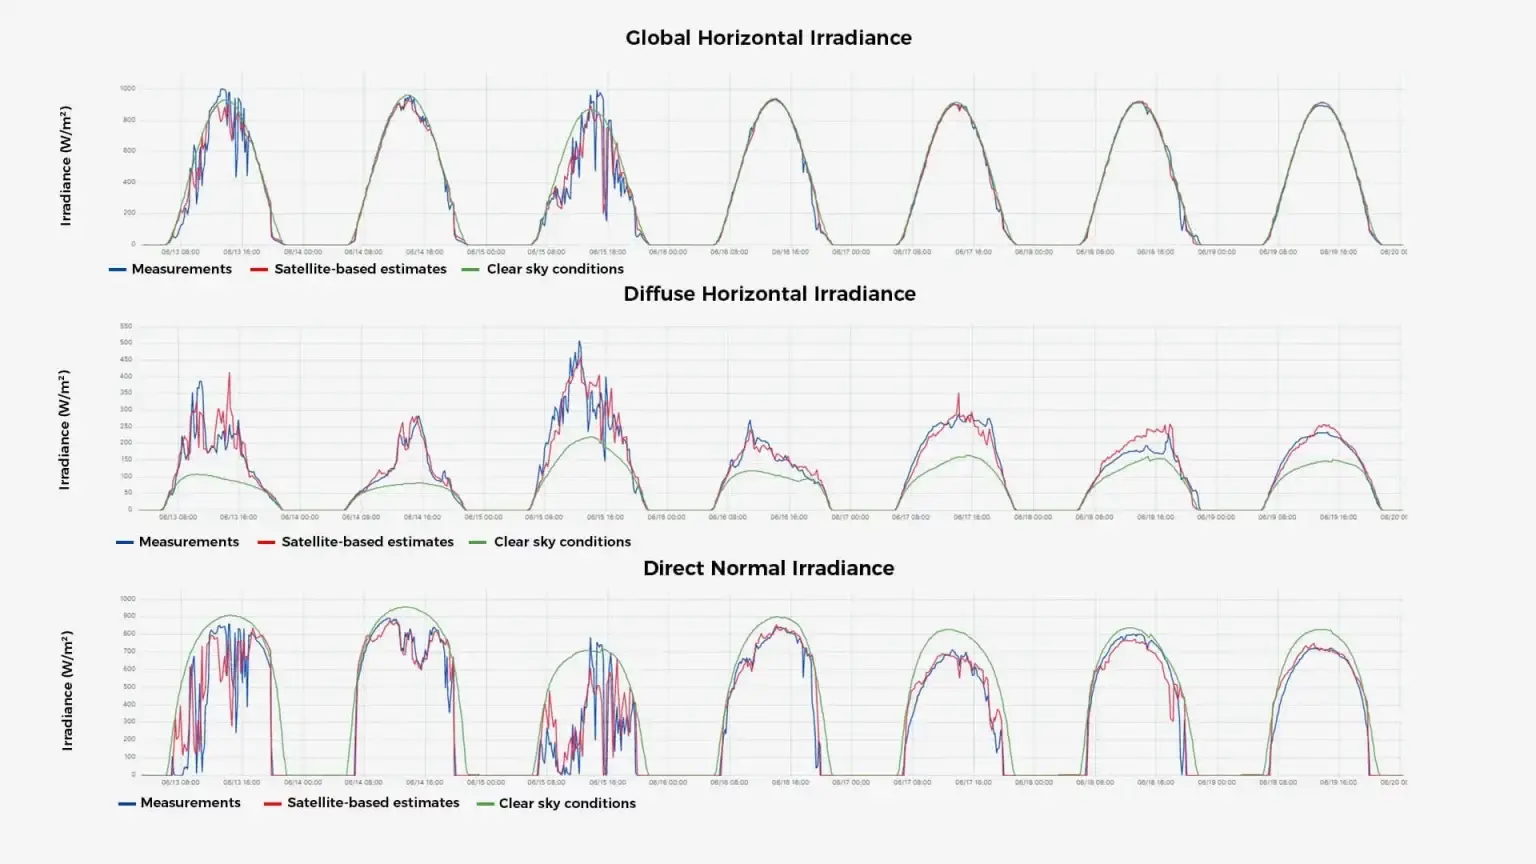
The Global Horizontal Irradiance (GHI) in clear sky and cloudy conditions are computed independently using advanced models for Radiative Transfer, parallax correction and shadow projections.
Then, separation and transposition models determine the direct (beam), diffuse and plane-of-array irradiance (DNI, DHI, GTI).
For photovoltaic applications, our physical models integrate detailed plant specifications to deliver accurate power production estimates:
t – 10 minutes
Up to every 10 minutes
Up to 1 minute
Power, solar irradiance data (GHI, GTI)
Get accurate solar forecasts anywhere in the world : forecasts by site, portfolio, city, region or country.
PV, Trackers, Bifacial, CSP
API, SFTP, etc.
Measure uncertainty through 11 quantiles (P00, P10, P20, …, P80, P90, P100)
Maximize efficiency, accuracy & performance with live insights
Monitor and analyze individual solar assets or entire portfolios. Our advanced technology reveals performance deviations and optimization opportunities across every installation in your fleet — from utility-scale plants to distributed rooftop systems.
Our machine learning algorithms continuously enhance accuracy by processing thousands of in-situ measurements from global observational networks. All incoming data undergoes rigorous quality control validation before algorithmic integration. You can easily integrate your own measurements into our system to get even more accurate estimates.
Access real-time solar resource data anywhere on Earth through our integration. Our processing system delivers consistent data quality across continents.
Optimize transactions on power markets. Reduce unbalancing costs. Manage risks.
Maximize the use of renewable energies while ensuring grid balancing.
Foster solar energy use. Reduce investment and operating costs.

Know the future profitability of your projects, taking into account weather variability.

Make your solar and wind power plants more profitable. Limit penalties, maximize revenues.

Get vast, timely environmental data to validate models, track phenomena, and accelerate discoveries.
Discover the best of SteadyWeb, our autonomous forecasting plateform. Optimize two plants free with Expert+ features – no commitment !
Get quarterly insights into the energy sector and our latest products.


