Reducing costs and risks in solar projects: The role of backtesting for solar project developers
Simulation and evaluation of retrospective forecasts for a PV+storage project located in Mauritius.
Case study
29/02/2024
by
Elena Escudero Ramos
10 min
null
null
Historical forecasts, also called hindcasts, refer to datasets resulting from a backcasting process that simulates the solar or wind energy forecasts as they would have occurred under operational conditions in the past. Hindcast data is instrumental in assessing forecasts for future operational decision-making, evaluating accuracy under specific weather conditions, and optimizing power plant designs.
null
null
null
null
null
The client’s need
Our customer is developing several hybrid photovoltaic (PV) + Battery Energy Storage System (BESS) power plants located in the northern part of Mauritius, nestled within the Indian Ocean. During the plant design phase, our client sought accurate hindcast data to mitigate capital costs and project risks. Like many insular regions, Mauritius heavily relies on coal and oil in its energy mix. Presently, nearly 10% of the country’s final energy consumption stems from modern renewable energy sources such as solar and wind power — a figure projected to ascend in the coming years. This underscores the increasing significance of power forecasting to address variability issues in this dynamic energy landscape.
Accurately forecasting solar energy in Mauritius poses a significant challenge due to the intricate interplay of large-scale and local weather patterns, including frequent cloud cover and significant variability in solar irradiance caused by tropical convection and microclimatic conditions. Steadysun was approached to furnish historical actual and forecast time series spanning one year for a single site, focusing on two key parameters: Global Horizontal Irradiance (GHI) and active power of the PV system (Power). Compliance with the Mauritius Grid Code requires the provision of three operational forecast types:
➡️ Intraday forecast (D): to be delivered every day before 4 a.m. UTC, at a 1-minute granularity,
➡️ Day-ahead forecast (D+1): to be delivered the day before at 3 p.m. UTC, at a 15-minute granularity,
➡️ Week ahead forecast (D+7): to be delivered every Monday at 12 p.m. UTC, at a 1-hour granularity.
null
Situated in the vast expanse of the Indian Ocean, Mauritius is positioned at approximately -20.3° latitude (south) and +57.6° longitude (east). The island experiences a tropical climate characterized by warm temperatures, high humidity, and distinct wet and dry seasons.
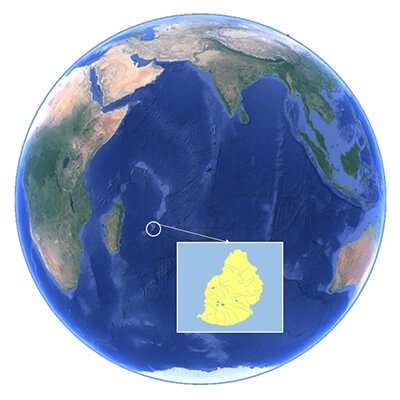
Situated in the vast expanse of the Indian Ocean, Mauritius is positioned at approximately -20.3° latitude (south) and +57.6° longitude (east). The island experiences a tropical climate characterized by warm temperatures, high humidity, and distinct wet and dry seasons.
Reducing costs and risks in solar projects: The role of backtesting for solar project developers
null
null
null
The solution
To address the client's requirements, Steadysun conducted comprehensive simulations using our solar forecasting product, SteadyMet, in an offline environment. The process to generate and evaluate the three different types of hindcast data encompassed the following steps:
1. Selection of the simulation period: Choosing a representative year for simulation is crucial to ensure the representativeness and relevance of retrospective data. By aligning with typical meteorological conditions and climatology at the solar installation site, simulation results are optimized over the project's lifespan and accurately reflect the constraints associated with solar production variability.
null
Interannual variability of the solar resource over a 10-year period, based on meteorological surface observations (Météo-France weather station).
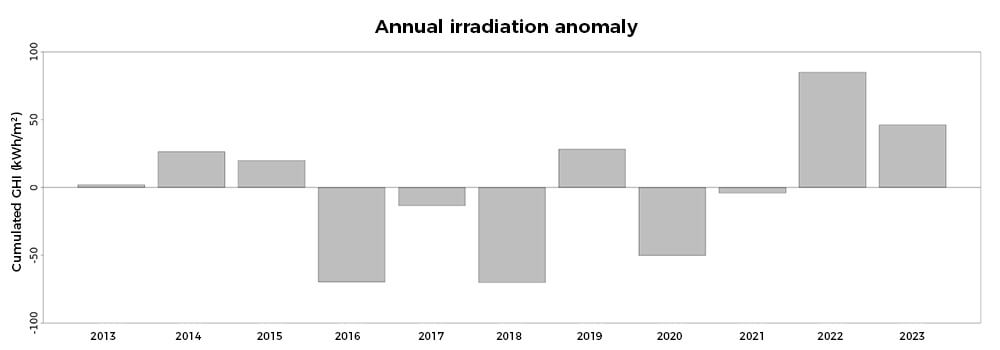
Interannual variability of the solar resource over a 10-year period, based on meteorological surface observations (Météo-France weather station).
null
null
2. Estimation of actual data: In the absence of on-site measurements, actual solar resource and production were estimated using satellite-derived data for GHI and atmospheric reanalysis (1) for temperature and wind speed parameters. Rigorous quality control routines were applied to address anomalies, followed by estimation of active power using PV modeling integrated into our forecasting system.
3. Generation of historical forecasts: Raw forecasts from various Numerical Weather Prediction (NWP) models were processed and optimized using machine learning techniques tailored to resolution and accuracy levels at the solar installation site. Probabilistic weather forecasts were converted into PV power forecasts using proprietary algorithms, calibrated against actual PV power data. Key configuration details of the solar installation, such as installed capacity, module inclination and orientation, and technical specifications of panels and inverters, were integral to this operation.
null
Examples of 15 hours ahead GHI raw forecasts from 6 NWP models over Mauritius and Reunion island, highlighting variability in weather predictions arising from differences in spatial resolutions, initial conditions, and other model characteristics.
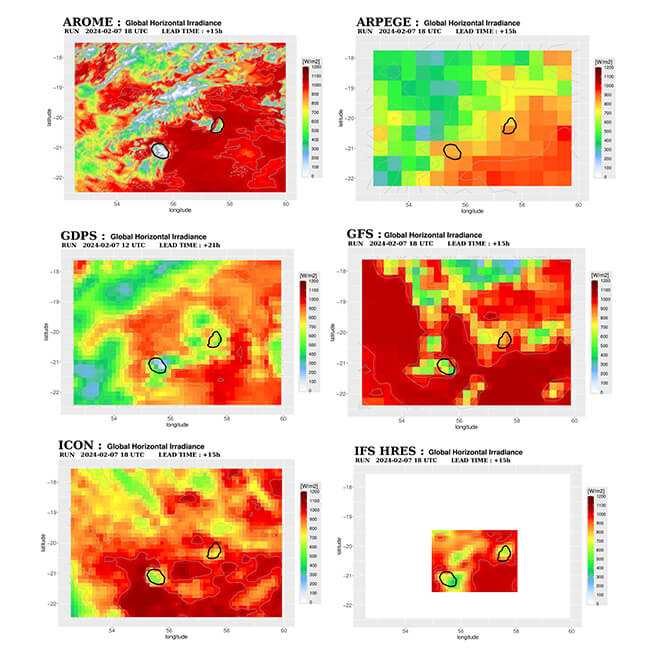
Examples of 15 hours ahead GHI raw forecasts from 6 NWP models over Mauritius and Reunion island, highlighting variability in weather predictions arising from differences in spatial resolutions, initial conditions, and other model characteristics.
null
null
4. Performance analysis and deliverable: Performance analysis involved calculating Key Performance Indicators (KPIs) normalized by reference GHI or installed capacity. KPIs included mean absolute error (MAE), mean bias error (MBE), and root mean square error (RMSE). A detailed technical report outlined methodologies and results.
null
null
null
null
The results
The performance analysis revealed strong results, with MAE values indicating a level of forecast performance representative of conditions encountered in tropical islands.
Comparison with persistence forecasts showed significant improvements (+15% to +31% depending on forecast horizon), highlighting the value of SteadyMet forecasts in optimizing project outcomes.
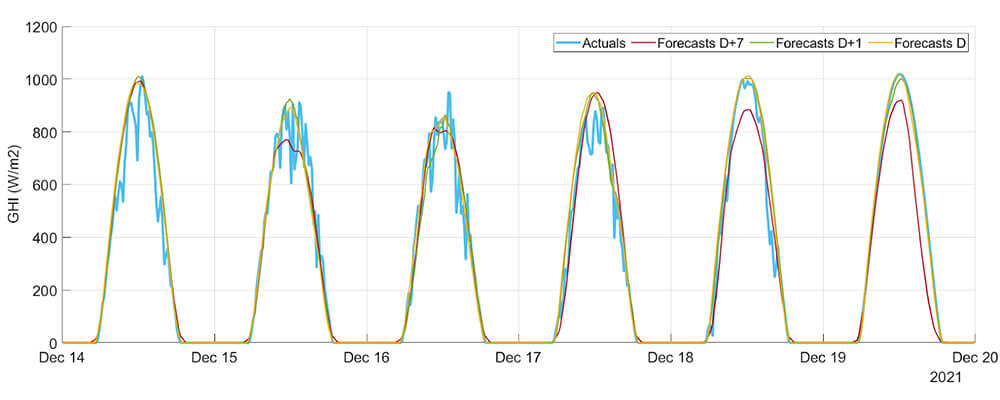
Example of simulation results over 6 consecutive days for GHI parameter: intraday (yellow), day-ahead (green) and weekly ahead (red) forecasts from SteadyMet compared to actuals estimated using satellite information (blue).
null
null
null
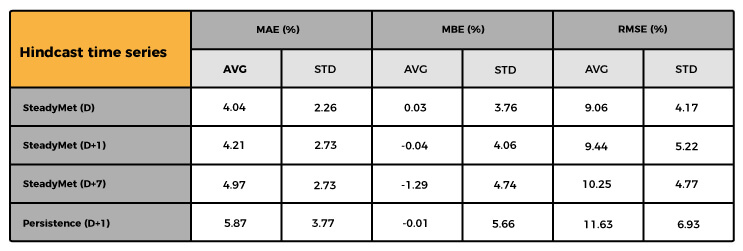
SteadyMet forecasts performances (MAE, MBE, RMSE) against actual data, compared to D+1 persistence model: average(AVG) and standard deviation (STD) of daily KPIs over one year.
null
null
null
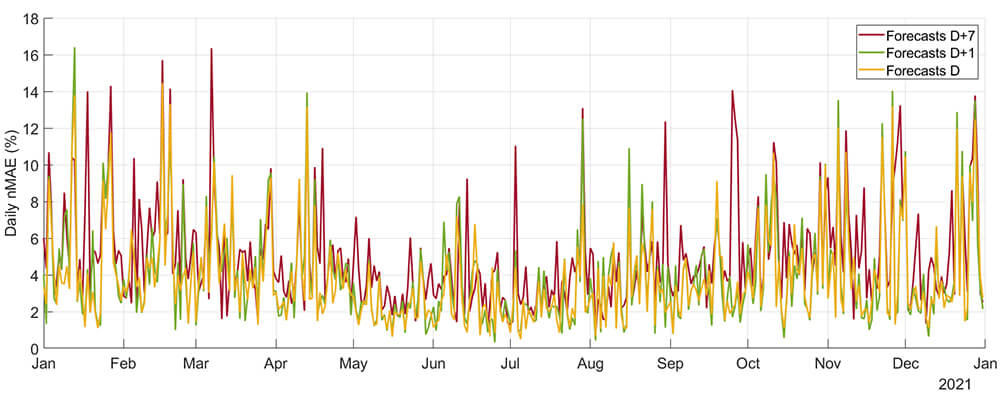
Annual evolution of the daily MAE for the 3 time horizons considered (D, D+1, D+7)
null
The benefits
The hindcast data provided valuable insights for the client to evaluate the performance of solar irradiance and power forecasts specific to the site. With this data, the client achieved the following:
1. Estimated the unbalancing costs associated with the project, such as the average penalties payable to the Mauritian power system operator, Central Electricity Board (CEB).
2. Optimized the sizing of the PV+BESS systems to mitigate these penalties.
3. Compared the accuracy of solar forecasts from various providers to select the most precise one for submission to the CEB, in compliance with the Grid Code, upon operational readiness of the plant.
null
null
Next steps
In PV+storage projects, the Energy Management System (EMS) plays a crucial role in cost optimization and revenue maximization. Hindcast data informs the development of optimal control strategies, enhancing energy management efficiency and grid integration (maximization of PV injection, minimization of PV curtailment, penalties and battery aging).
Ultimately, our client can use our solar forecast API to optimize hybrid plant operations and comply with the CEB's Grid Code requirements after commissioning. Further operational enhancements are possible through: 1) the refinement of intraday forecasts using SteadySat nowcasting, 2) real-time statistical corrections based on on-site measurements, and 3) the implementation of a tailored very high-resolution regional weather forecasting model to further enhance forecast accuracy for small-scale phenomena on the island.
null
null
null
null
null
null
null
null
null
null
null
null
null
null
null
null
null
Note
1. ERA5 ECMWF reanalysis data is available on the Copernicus Climate Data Store website
null
null
null
null
null