The client’s need
Founded in 2005, our client’s company is committed to supplying households and businesses in Spain with electricity generated exclusively from renewable energy sources, with guarantees of origin. He contacted us in 2019 to support him in his electricity trading activities in the Spanish energy market. Their portfolio initially encompassed a 400MWp photovoltaic (PV) portfolio spanning the whole Iberian Peninsula. Currently, the portfolio has expanded substantially to nearly 2GWp, including fixed-tilt, single-axis and dual-axis solar installations.
The client participates in OMIE power exchange bids for the day-ahead market and aims to minimize portfolio balancing costs. Consequently, they require twice-daily delivery of day-ahead forecasts for the total aggregate.
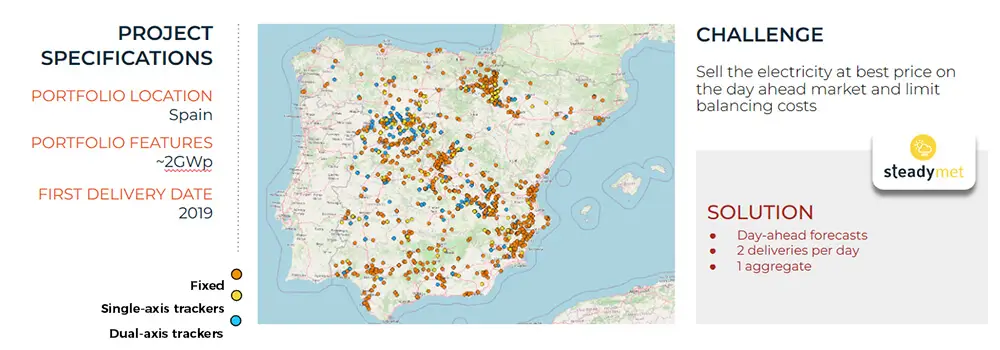
Synthesis of the client‘s need, portfolio‘s features and delivered Steadysun‘s solution.
The solution
To meet the client’s requirements, we implemented our Power Trading Solution anchored by our SteadyMet forecasting product. This product harnesses Numerical Weather Prediction models from various meteorological services (ECMWF, NOAA, Météo-France, DWD, etc.) to furnish best-in-class power forecasts. Our operational forecasts pertain to solar production across an array of virtual power plants, mirroring the evolving nature of the client’s portfolio over time and space. These virtual power plants encompass the geographical and technical specifications of installed capacities.
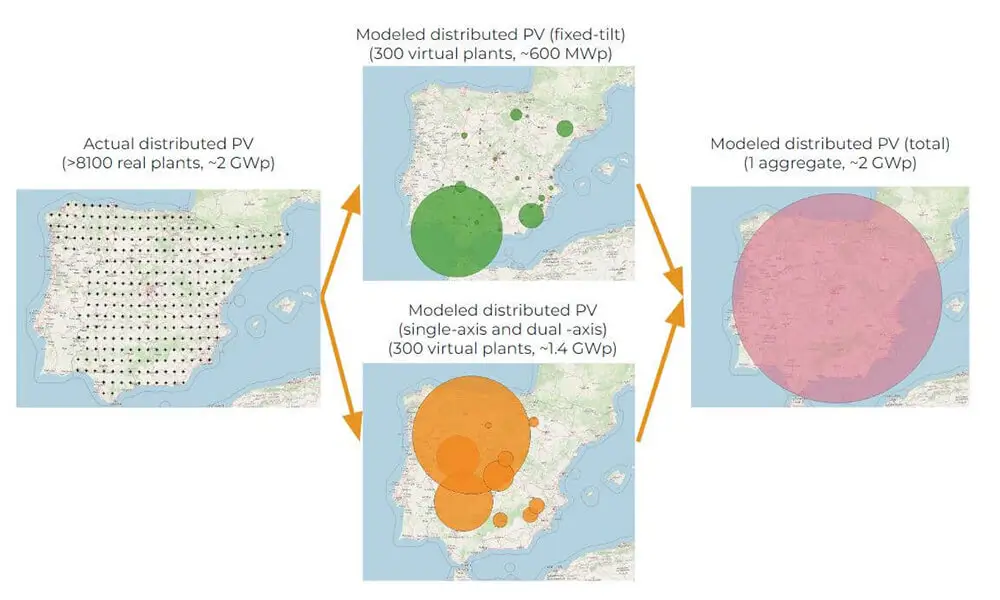
Methodology for aggregating data from 8100 sites using virtual plants.
This project presents multiple challenges. Firstly, the scarcity of information regarding the portfolio characteristics and the presence of non-uniform information. Only the GPS coordinates and type of solar technology are available; details such as panel orientation, tilt, or brand remain unknown. Furthermore, a single point might correspond to either an individual installation or a group, including multiple orientations/tilts. Secondly, the rapid expansion of the portfolio requires effective management. Addressing these issues involves the client’s regular submission of PV portfolio updates. We automatically process this information into a standardized matrix, representing the portfolio, and deliver the forecasts via our API.
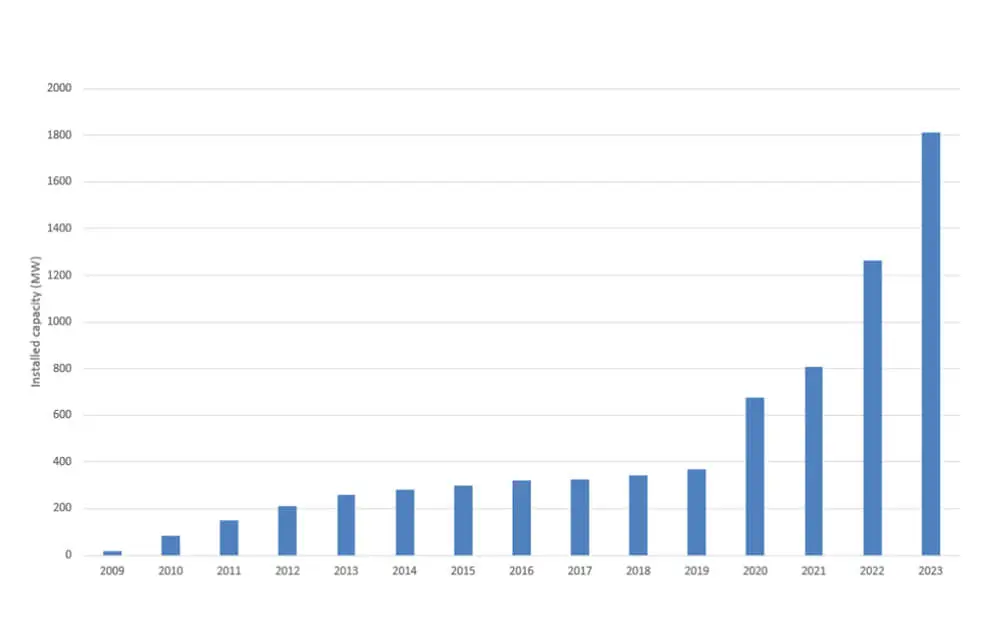
Yearly evolution of the PV portfolio in MWp.
The results
In 2022, the normalized Mean Absolute Error (nMAE) [1] for the entire portfolio stood at approximately 2%, aligning with our expectations. Instances of extreme errors (exceeding 6%) were infrequent, accounting for around 0.7% of the time. They remained below 2% for over 56% of the time. Consequently, our solution facilitated a potential reduction in balancing costs of up to €7/MWh [2].
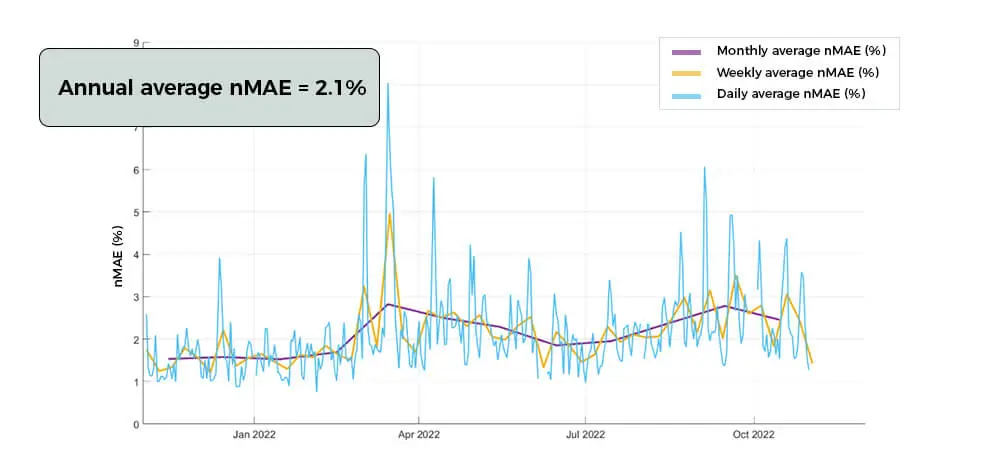
Year 2022 nMAE trends on a daily, weekly, and monthly basis for the complete portfolio.
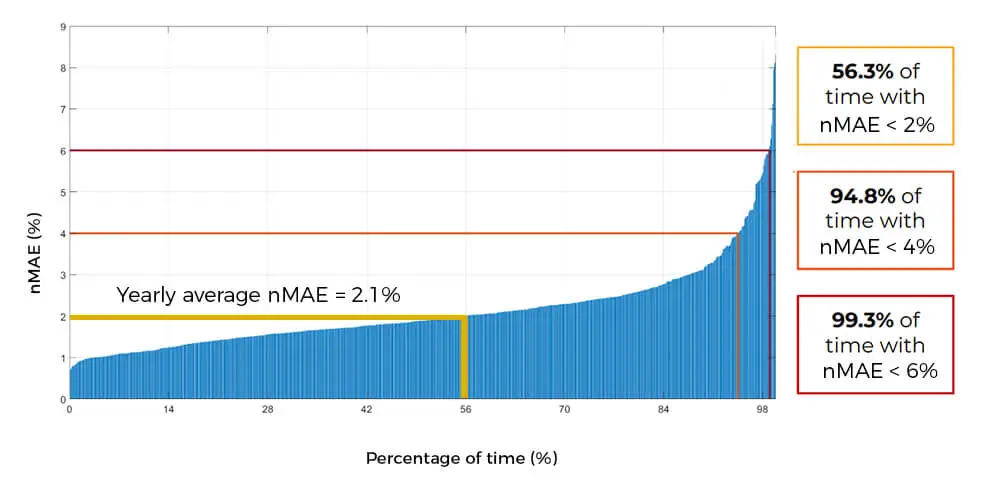
Classification of errors for the entire portfolio in the year 2022.
The benefits
Our forecasting solution provides the client with the following benefits:
- Cost Reduction: Attain up to 60% reduction in balancing costs thanks to accurate forecasting.
- Limiting simultaneous errors: our unique approach, combining physical modelling and artificial intelligence, avoids simultaneous errors with other market participants and allows limiting the impact of price volatility caused by them.
- Portfolio Management: Manage expansive portfolios with ease, courtesy of our accessible and scalable API founded on a modern RESTful approach.
Next steps
The client’s strategy is to explore transitioning from portfolio-level forecasts to installation-level forecasts. This strategic shift aims to grasp a more detailed comprehension of the effects on his portfolio. By concentrating on individual assets, the client aims to enhance the accuracy of their analytics. This approach empowers them to fine-tune optimization strategies, grounded in comprehensive analyses of each asset’s performance within the portfolio.
Furthermore, in the long term, he plans to enter positions in the intraday market and aims to assess the added value of our forecasts within this time horizon. Finally, he is exploring how to improve consumption forecasting using highly accurate temperature forecasts at regional scale.
Notes:
- The normalized Mean Absolute Error (nMAE) is calculated based on half-hour ranges. This is consistent with the usual functioning of the electricity network. To quantify the forecasts or the daily production, we consequently have a set of 48 values corresponding to 48 time slots of 30’ each (1rst value = average between 00.00 am and 00.30 am, 2nd value = averages between 00.30 am and 01.00 am and so on).
Powers are normalized by the peak power in order to allow comparisons between a power plant and another one (see equation 1).
A value for the daily nMAE is then calculated for each day and for each year (see equations 2 and 3).
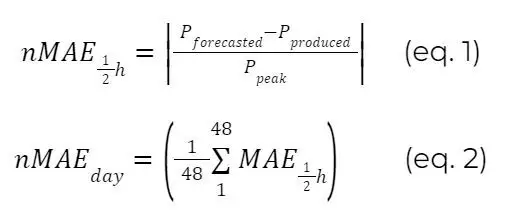
Where Pforecasted and Pproduced are the average power planned and realized on the considered 30’ time slot, Ppeak is the peak power and “48” is the number of half an hour time slots of the day.
The accuracy of the forecast system on a given power plant will then be estimated by averaging the daily MAE’s on all the available days (see equation 3).
Where Nday is the number of days for which a daily MAEday is available.
- Estimations based on a benchmark conducted in 2022. Steadysun’s nMAE 2.1%. Other provider’s nMAE up to 4%. Total 2021 imbalance costs: €11/MWh.