The energy world is undergoing a profound transformation. The increasing electrification of various sectors and the massive influx of decentralized and variable renewable production are two fundamental pillars of the energy transition needed to achieve carbon neutrality. While Steadysun has primarily been associated with solar energy for the past decade, it’s time for us to set a new course: the realm of wind energy! And what if the sun and the wind were ultimately more closely intertwined than you imagine? Let yourself be carried away for a moment by the breath of our star and the radiance of our expertise!
The energy of the Sun: the driving force behind atmospheric phenomena
The gases that compose our atmosphere are subject to solar radiation that penetrates the upper atmosphere. The sun is the vital lung of our planet, the primary energy source for Earth’s system, indirectly orchestrating most atmospheric circulations through the warming of the Earth’s surface. This engine, however, is anything but uniform and stable. It dances to the rhythm of astronomical cycles, influencing the angle of sunlight that reaches the Earth’s surface and oceans, thus affecting meteorological phenomena at various spatial and temporal scales (Figure 1).
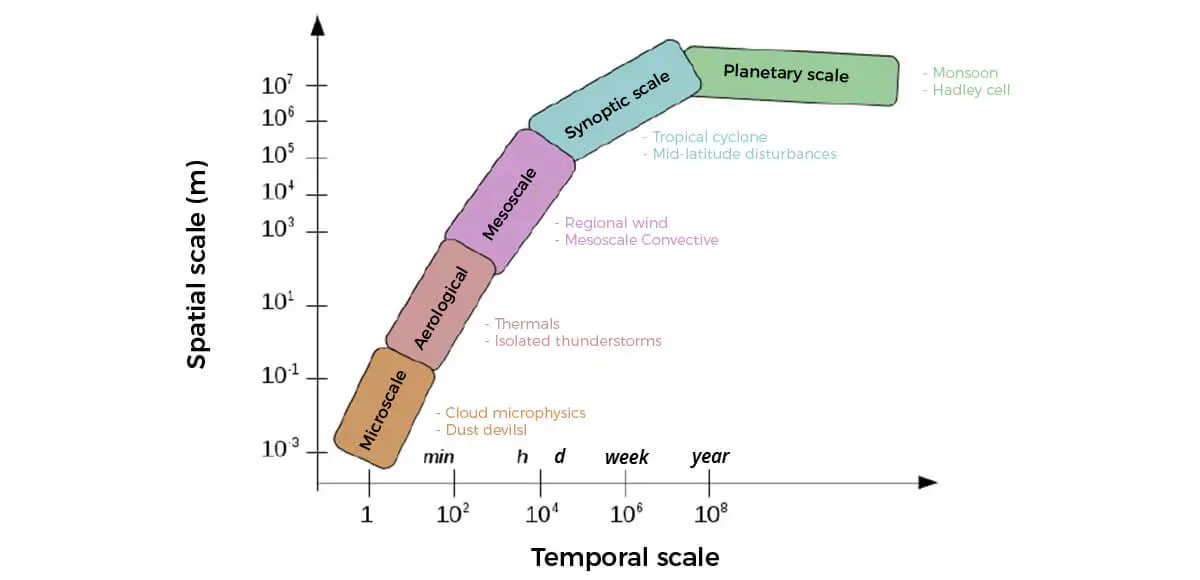
Figure 1: Classification of major atmospheric phenomena according to their spatiotemporal scale (adapted from Malardel, 2005) [1].
Planetary scale
On a planetary scale (~10,000 km), the sun plays a conductor role in all atmospheric phenomena. A fascinating example of this influence is the Hadley cell, an essential component of the global atmospheric circulation (Figure 2). This cell originates in response to radiative imbalances between the poles and the equator (Figure 3a) and between the Earth’s surface and the tropopause, the upper boundary of the troposphere. Two vast hemispheric cells, characterized by axial symmetry, are responsible for the transport – or redistribution – of thermal energy from the equator to approximately 30° of latitude (Figure 3b).
Monsoons and weather patterns are also phenomena that influence large-scale winds over periods of several weeks or months, responding to variations in Earth’s surface energy balance.
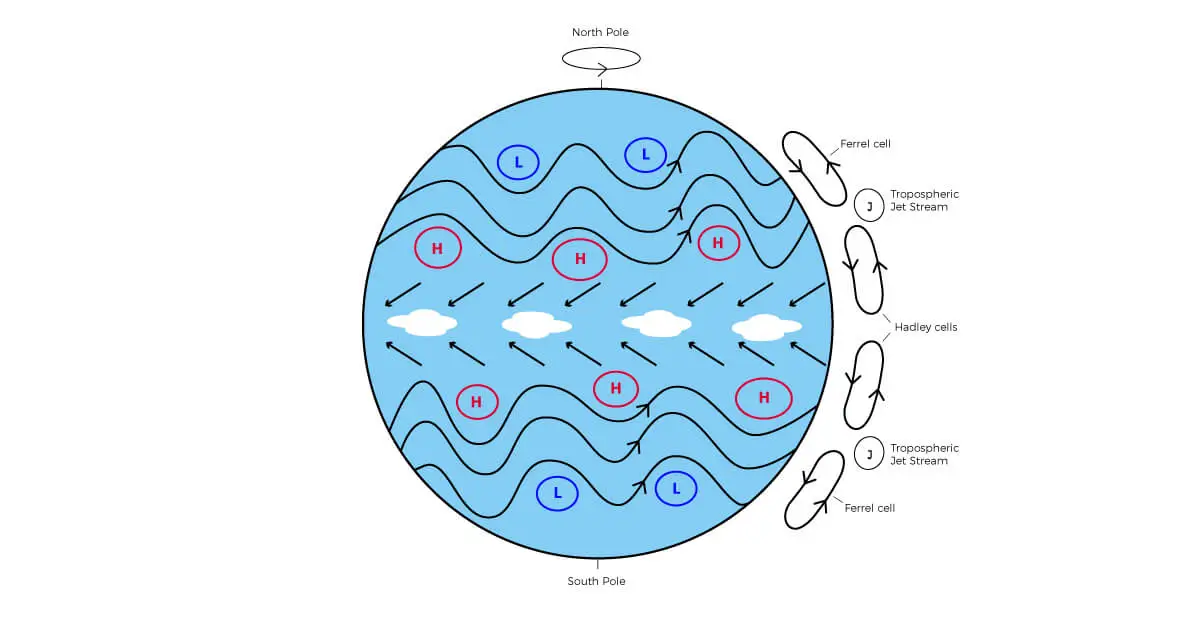
Figure 2: Schematic representation of sea-level pressure isobars and surface winds with the Sun directly overhead at the equator (adapted from Wallace & Hobbs, 2006) [2].
Figure 3: Monthly climatologies a) of net radiation (W/m²) at the top of the atmosphere (balance of absorbed and emitted fluxes) and b) of mean zonal wind (m/s) throughout the atmosphere. ERA5 reanalysis data produced by the European Centre (ECMWF Copernicus).
Synoptic scale
At the synoptic scale (~1,000 km), the sun continues to influence atmospheric dynamics. This category mainly includes depressions and anticyclones that develop primarily over oceans at mid-latitudes (Figure 4) in response to large-scale solar heating variations combined with the Earth’s rotation. Depressions form in areas of ascent, generating strong winds during storms, while high-pressure systems form in subsidence areas, potentially leading to periods of eolian drought (characteristic situations of summer heatwaves in Europe).
Tropical cyclones, with one of the major ingredients being warm ocean waters, also occur at this spatiotemporal scale, producing destructive winds and heavy precipitation.
Figure 4: Low pressure system over Western Europe in March 2023. Wind speed and direction at 10m and sea-level pressure. Forecast from the German ICON-EU model (DWD).
Mesoscale
At the mesoscale (10-100 km), phenomena such as land/sea breezes come into play, resulting from differences in heating between land and sea. During the day, the land heats up more quickly than the sea, creating a low-pressure zone above the land. The cooler air above the sea then moves toward the land, creating the sea breeze blowing from the sea to the land. At night, when the land cools faster, the phenomenon reverses, generating the land breeze with winds blowing from the land to the sea. This diurnal cycle, common on coastlines, can significantly influence local weather conditions, especially on islands.
As the name suggests, Mesoscale Convective Systems (squall lines, derechos, etc.) are also among the phenomena to be noted here. Formed in an unstable air mass, they generally bring winds of over 90 km/h over hundreds of kilometers in length, for characteristic times of a few hours (Figure 5).
Figure 5: Mesoscale Convective Systems in West Africa (MSG satellite data – 0 degree, IR10.8 μm channel and precipitation estimate, EUMETSAT).
Aerological scale
At the aerological scale (0.1-10 km), the sun plays a crucial role in the formation of isolated thunderstorms, tornadoes, and pure thermal phenomena. Solar heating of the Earth’s surface triggers air convection, creating pockets of warm air that rise and can lead to thunderstorms and other violent weather phenomena (Figure 6).
Figure 6: Convective cells developing on the island of Tahiti (French Polynesia): solar radiation and wind field at 10m predicted by the WRF-1km model operated by Steadysun.
Microscale
Finally, at the microscale (~1 m), phenomena such as dust devils and gusty winds appear. Slight heating variations between surfaces create unstable air zones that generate these swirls and sudden winds.
When the wind also influences solar energy
So, the sun is undoubtedly the primary driver of the wind. But is the solar resource available at the surface and the production from conversion plants not, in turn, influenced to some extent by atmospheric dynamics? Here are some non-exhaustive examples.
From meteorologists’ perspective
By transporting water vapor from evaporation zones (e.g., oceans) to condensation zones (e.g., continents), winds participate in cloud formation, which then interacts with solar radiation (reflection, absorption, diffusion). It’s worth noting that water vapor also absorbs a portion of solar radiation, depending on its integrated content throughout the atmospheric column. Thus, the solar resource depends on wind patterns.
Winds also transport atmospheric aerosols, such as desert dust, smoke from forest fires, sea spray, volcanic ash, sulfates, and more (Figure 7). These tiny solid or liquid particles suspended in the air impact the solar resource in two ways: 1) through reflection, absorption, and diffusion — similar to water droplets forming clouds, and 2) indirectly, as aerosols act as condensation nuclei around which these same cloud droplets form. Thus, through the complex clouds-aerosols-radiation interactions, the wind is a determining factor in solar energy.
Figure 7: Evolution of total aerosol quantity integrated in the vertical column of the atmosphere globally. AOD550 forecast by the CAMS model (Copernicus).
From energy professionals’ perspective
Wind speed alters the temperature of photovoltaic (PV) modules. The higher the speed, the more panels will tend to cool and the higher their efficiency will be — all else being equal (Figure 8). Conversely, the hotter it gets, the lower the efficiency (up to 0.5% performance loss per degree).
Dust and other particles carried by the wind can settle on solar panels (soiling), causing additional losses that vary depending on the region: from minor losses (1-2%) in areas with regular precipitation, such as the eastern United States or most of Europe, to high losses (up to 80% at the peak) in the Middle East after sandstorms, with annual losses of 20% or more (NREL, 2022) [3].
As a result, numerous feedback mechanisms exist between wind energy and solar energy. Understanding all these interactions is crucial to optimize their development and integration into power systems.
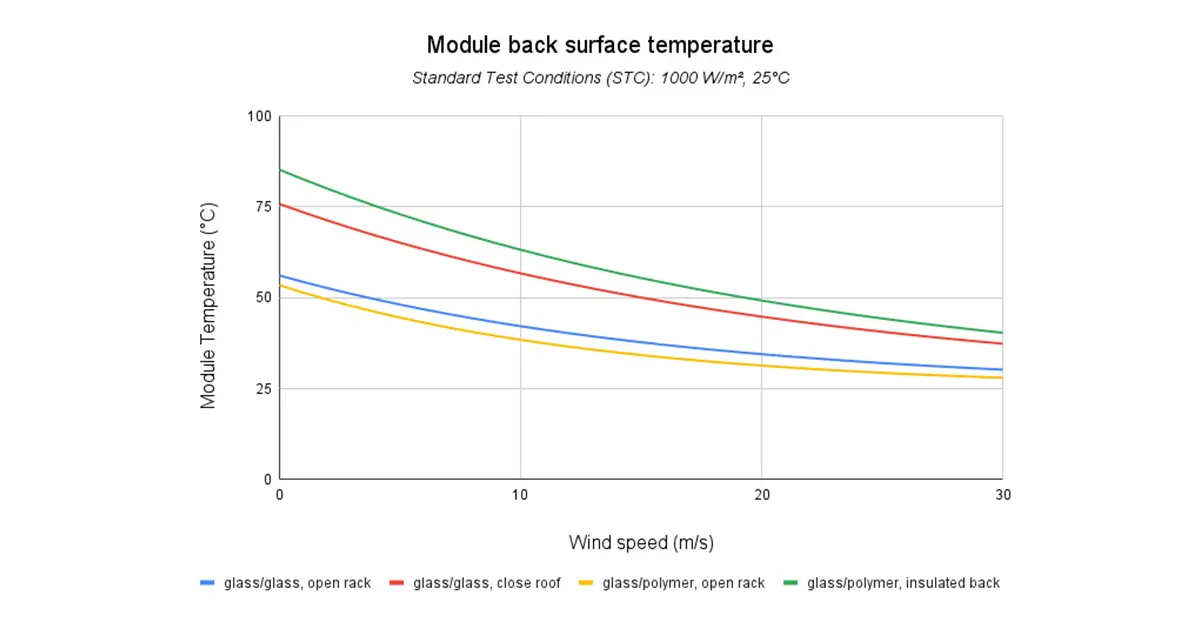
Figure 8: PV module temperature as a function of wind speed under standard test conditions (1000 W/m², 25°C) for different module types and structures (King et al. model, 2004) [4].
Solar and wind: a natural alliance
In the global landscape of energy transition, solar and wind power stand as indispensable pillars to achieve greenhouse gas (GHG) emissions reduction targets. Their significance will dramatically increase in the coming decades, with installed capacities expected to multiply several-fold on a global scale by 2030-2050, according to the International Energy Agency (IEA) (Figure 9). In France, Réseau de Transport d’électricité (RTE) plans a 30 to 40% increase in electricity consumption by 2035. To meet these needs and decarbonize the energy mix, it is essential to quadruple wind and solar production.
Together, solar and wind form a natural alliance, representing a significant share of future production mixes, primarily composed of low-carbon and renewables. They are capable of meeting the growing electrification demand and ultimately making a substantial contribution to reducing GHG emissions. This synergy is a vital element in shaping our climate pathways and building a more sustainable world for future generations.
However, as we’ve seen before, solar and wind are inherently tied to weather conditions and are, therefore, variable in space and time. Their predictability is further limited due to the chaotic nature of the atmosphere, impacting the entire electricity value chain — production, transport, distribution, consumption. Therefore, it’s necessary to massively develop and aggregate flexibility mechanisms (dispatchable production, demand response, storage, interconnections, etc.) to cost-effectively integrate these new energy sources into the mix while continuing to ensure the security of supply and the stability of electrical systems.
This is where forecasting solutions come into play. Indeed, accurately anticipating weather conditions and, consequently, power plant production from a few minutes to several days in advance enables the efficient management of flexibilities. However, it’s essential to fully harness the potential of this solar-wind alliance, which our forecasting system now enables!
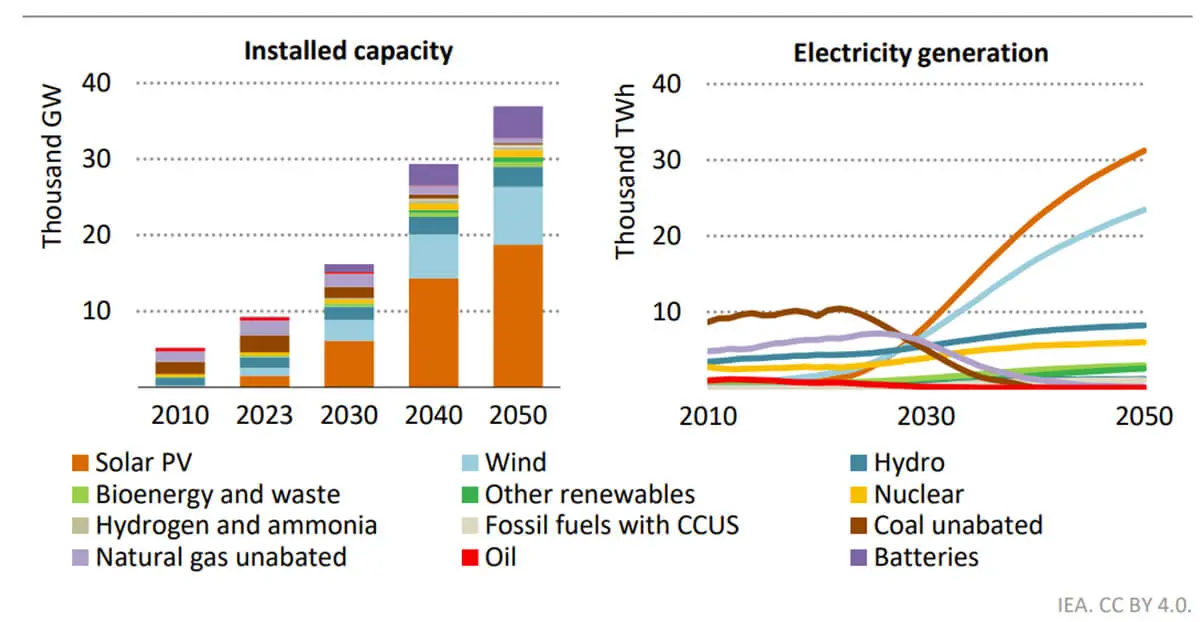
Figure 9: Total installed capacity and electricity production by source in the Net Zero Emissions (NZE) scenario, 2010-2050 (IEA, 2023) [5].
When the frog croaks energetically
Our expertise in meteorology and artificial intelligence (AI) has led us to develop Frogcast in recent years, our meteorological forecasting platform serving weather-sensitive sectors, including energy.
One of Frogcast’s major strengths lies in its premium accuracy. Born of our unique expertise in combining multiple numerical models, optimized by meteorologists, and enhanced by AI, this platform provides high-resolution forecasts for around twenty atmospheric parameters up to 15 days in advance.
Another key advantage lies in its ultra-local resolution. With customized weather forecast models down to 1 km and local adaptations based on 90 m terrain models, small-scale phenomena are rigorously taken into account. This granularity is particularly beneficial for wind and solar farms, where local phenomena significantly impact electricity production.
Frogcast goes beyond traditional weather forecasts and offers probabilistic information. By providing 10 confidence intervals (quantiles) for each atmospheric parameter, it empowers end users to more effectively manage the risks associated with weather variability and forecast uncertainties, ultimately optimizing the management of energy resources.
Finally, whether you operate at sea, in the desert, on a tropical island, or in the heart of a bustling metropolis, our platform provides meteorological intelligence worldwide, adapting to each region for optimal local relevance.
In short, it’s an essential tool for developers of digital solutions serving weather-sensitive sectors, such as Steadysun. By using our new Application Programming Interface (API), you can fully harness the natural alliance between the sun and the wind.
After configuring your service in the simplest and most intuitive way possible (asset location, technical specifications of systems, required forecasts, etc.), our energy conversion models are activated instantly and enhance weather forecast data through a hybrid approach that combines physical equations and parameters (vertical wind profile in the boundary layer, turbine type and height, etc.), as well as AI (machine learning post-processing, etc.).
You can also provide us with your real-time production data via the API to facilitate performance analysis and improvements (Figure 10).
Steadysun: your new wind forecasting partner
In conclusion, wind and solar energy are closely linked, and we are proud to serve you as a unique partner for your solar and wind projects!
Why choose Steadysun for your wind portfolio?
- Accuracy is our guiding principle. We are committed to providing wind production forecasts with the same high quality standards as our solar forecasts.
- Our diverse models allow us to offer forecasts for time horizons ranging from hours to days in advance, with a very high update frequency.
- Our data covers the entire globe, accommodating all technologies (onshore and offshore) and all scales, whether you manage a wind farm, a portfolio of assets spread over a territory or even across multiple countries.
- Our track record is undeniable throughout the value chain (production, networks, consumption), with trust established at over 14,000 sites and in more than 25 countries.
- Managing your solar and wind assets through a single platform is essential to optimize the use of renewable energy. With our unique and user-friendly API, you can easily access all our services, including site and forecasting service configuration, bilateral data exchange, real-time visualization, performance analysis, and much more.
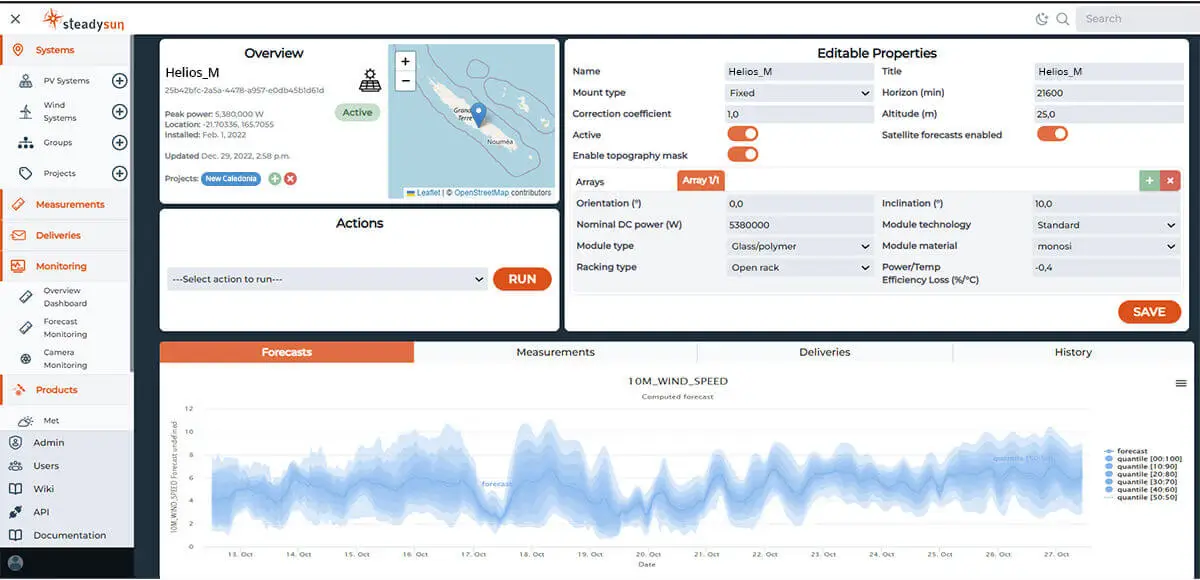
Figure 11: Web interface for configuring, monitoring, and analyzing our forecasting services.
References
[1] Malardel, S., 2005, Fondamentaux de Météorologie, 2è édition, à l’école du temps.
[2] Wallace & Hobbs, 2006, Atmospheric Science, an introductory survey, second edition.